Getting Started#
The easiest way to get started using repliclust is to create
synthetic data sets from high-level descriptions in English. Our
natural language recognition builds on OpenAI’s API, so using these
features requires providing your OpenAI API key. You can set it as
OPENAI_API_KEY=<...> in an .env file, or pass it to individual
functions as a keyword argument openai_api_key=<...>.
Once the package recognizes your OpenAI key, you generate data
directly using the repliclust.generate function. For example,
import repliclust as rpl
X, y, archetype = rpl.generate(
"seven clusters with very different shapes and different distributions, and mild overlap"
)
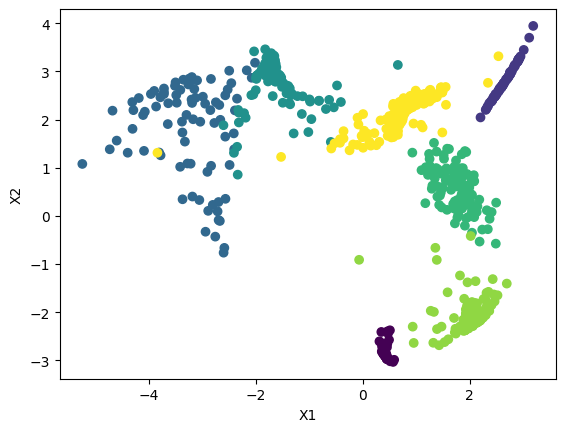
rpl.plot(X, y)
The repliclust.plot function is convenient for creating plots in
a notebook environment; it will automatically apply t-SNE (or UMAP)
dimensionality reduction if the data has more than two dimensions.
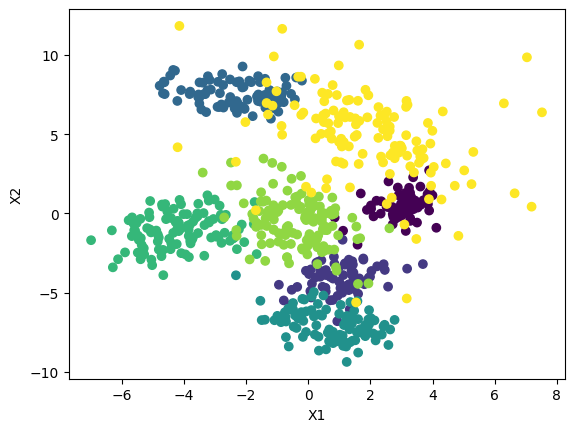
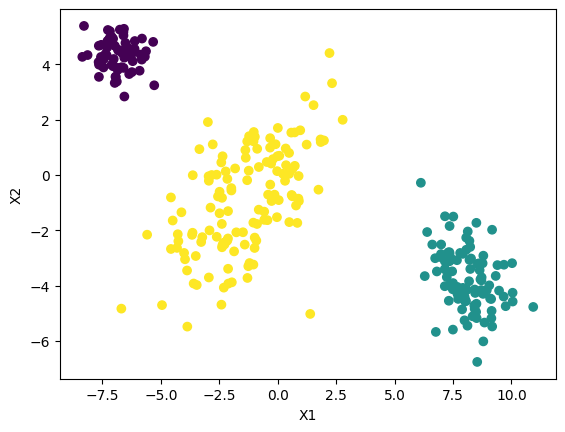
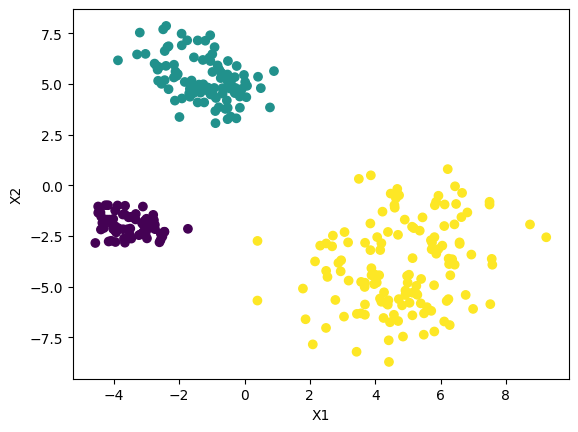
Rather than directly generate data, you can first create an archetype. The
Archetype.describe function prints the parameters of your archetype. to
understand what these parameters mean, read Specifying an Archetype.
For example, .. code-block:: python
import repliclust as rpl
- archetype = rpl.Archetype.from_verbal_description(
“three gamma-distributed clusters in 10D, of which some are long and some are spherical, that are well-separated”
)
archetype.describe()
Once an archetype has been defined, you can use it directly to create many different data sets. Continuing our example,
X1, y1 = archetype.synthesize(quiet=True)
X2, y2 = archetype.synthesize(quiet=True)

rpl.plot(X1,y1)
rpl.plot(X2,y2)
To create irregular cluster shapes, you can use the repliclust.distort and
repliclust.wrap_around_sphere functions. The first function creates clusters
with irregular shapes by passing data through a randomly initialized neural
network. This function may not work properly if you do not have a GPU with CUDA
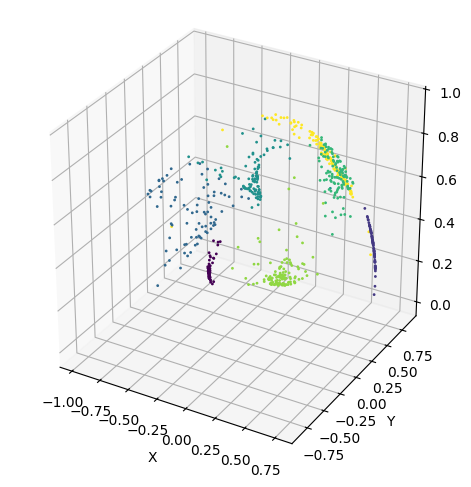
support. The second function wraps a data set around the surface of the sphere.
A 2D data set is wrapped around the surface of the three-dimensional sphere, a 3D
data set is wrapped around the 4D sphere, etc.
X, y, _ = rpl.generate("seven clusters with very different shapes")
X = rpl.distort(X)

rpl.plot(X,y)
X = rpl.wrap_around_sphere(X)

rpl.plot(X,y)